
Concepts Of Physics MCQ Edition [Volume 2]
- Exam
- Concepts Of Physics MCQ Edition [Volume 2]
- Subject
- Physics
- Chapter
- Electric Current through Gases
Concepts Of Physics MCQ Edition [Volume 2] · Physics · Electric Current through Gases
Suppose i_0 represents the thermionic current emitted from a metal...
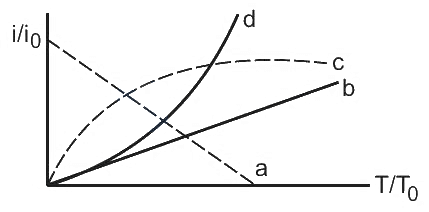
Suppose represents the thermionic current emitted from a metal surface at an absolute temperature . If the temperature is gradually increased and the thermionic current is recorded as a function of temperature, which of the following graphs could illustrate the variation of with respect to ?
Options
- Ac
- Bb
- Cd
- Da
Correct answer
C. d
Step-by-step solution
According to the Richardson-Dushman equation, the thermionic current emitted from a metal surface at an absolute temperature is given by:
where is a constant, is the work function of the metal, and is the Boltzmann constant.
At temperature , the current is:
Taking the ratio of the two currents, we get:
Let and . The equation becomes:
As (or ) increases, both the term and the exponential term increase. The function grows very rapidly, meaning its slope continuously increases (the curve is concave upwards).
Looking at the given graphs:
- Curve a has a negative slope.
- Curve b is a straight line (constant slope).
- Curve c is concave downwards.
- Curve d is concave upwards and shows rapid exponential growth.
Thus, curve d correctly illustrates the variation of with respect to .
where is a constant, is the work function of the metal, and is the Boltzmann constant.
At temperature , the current is:
Taking the ratio of the two currents, we get:
Let and . The equation becomes:
As (or ) increases, both the term and the exponential term increase. The function grows very rapidly, meaning its slope continuously increases (the curve is concave upwards).
Looking at the given graphs:
- Curve a has a negative slope.
- Curve b is a straight line (constant slope).
- Curve c is concave downwards.
- Curve d is concave upwards and shows rapid exponential growth.
Thus, curve d correctly illustrates the variation of with respect to .