Quantrex Quantrex AcademyJEE · NEET · NDA PYQs with solutions Open app
NEET
Exam
NEET
Subject
Physics
Chapter
Thermodynamics

NEET · Physics · Thermodynamics

A graph of pressure versus volume for an ideal gas for different...

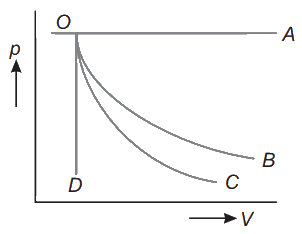
A graph of pressure versus volume for an ideal gas for different processes is as shown. In the graph curve OCO C represents
A graph of pressure versus volume for an ideal gas for different processes is as shown. In the graph curve O C

Options

  1. Aisochoric process
  2. Bisothermal process
  3. Cisobaric process
  4. Dadiabatic process

Correct answer

D. adiabatic process

Step-by-step solution


A graph of pressure versus volume for an ideal gas for different processes is as shown. In the graph curve O C
(i) Curve OA represents isobaric process (since pressure is constant) Since, the slope of adiabatic process is more steeper than the isothermal process. (ii) Curve OB represents isothermal process. (iii) Curve OC represents adiabatic process. (iv) Curve OD represents isochoric process (since volume is constant).
Practice Thermodynamics on Quantrex Academy →

More from Thermodynamics

The work done by an ideal gas during closed cycle 1arrow 2 arrow 3 arrow 4 arrow 1 as… MHT CET Medical 2026Which of the following statements is NOT CORRECT? In an isothermal process, a. there is… MHT CET Medical 2026Let η_1 be the efficiency of a Carnot engine at T_H = 547^ ^ ∘ C and T_C = 247^ ^ ∘ C… MHT CET Medical 2026Identify the INCORRECT statement for isobaric process. MHT CET Medical 2026A gas for which γ = 5 / 3 \ (γ = C_p / C_v ) is heated at constant pressure. The… MHT CET Medical 2026A mono-atomic ideal gas, initially at temperature T_1 is enclosed in a cylinder fitted… MHT CET Medical 2026A gas for which γ is 3/2 is heated at constant pressure. The percentage of heat supplied… MHT CET Medical 2026One mole of an ideal gas in initial state A undergoes a cyclic process ABCA, as shown in… MHT CET Medical 2026 Full Thermodynamics list All NEET PYQs