
NEET 2026
- Exam
- NEET
- Year
- 2026
- Subject
- Physics
- Chapter
- Motion in One Dimension
NEET 2026 · Physics · Motion in One Dimension
The following plots show variation of velocity ( v ) with time ( t...
The following plots show variation of velocity () with time (), of a ball thrown vertically upward, and falling back. Which of the following plots is/are correct ?
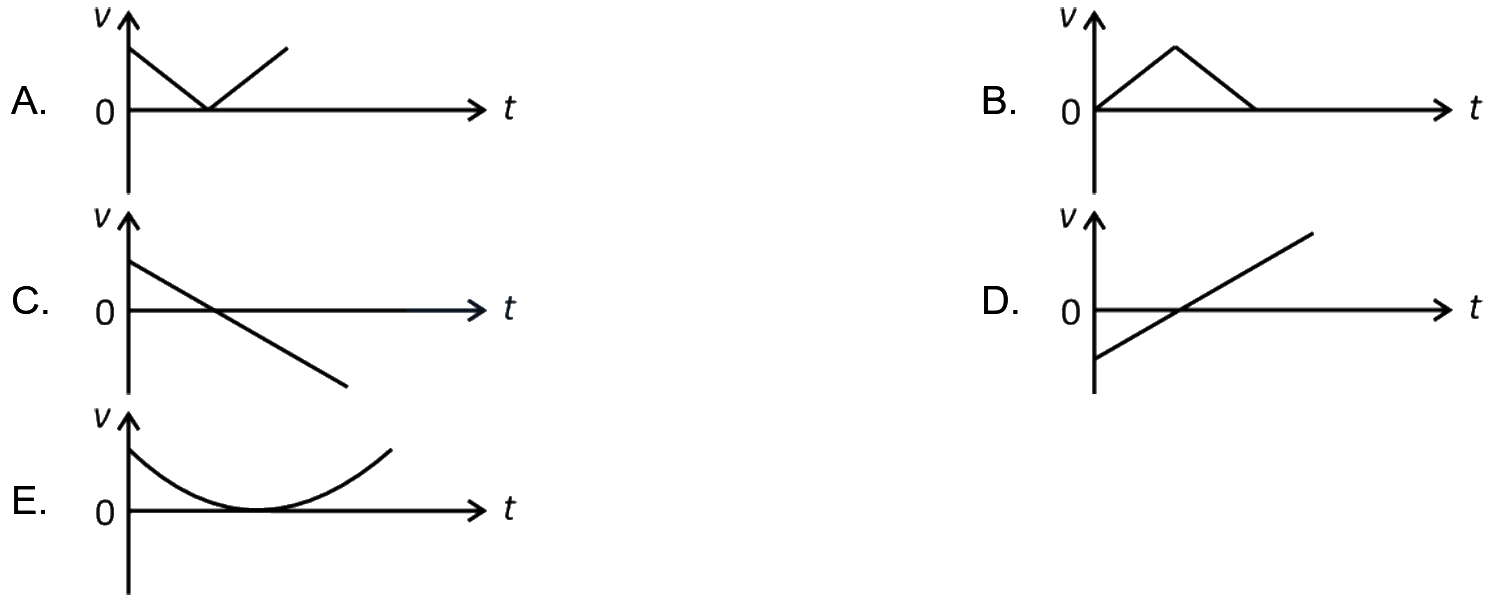
Options
- AC only
- BD only
- CB only
- DA and E only
Correct answer
A. C only
Step-by-step solution
Let the upward direction be considered positive.
When a ball is thrown vertically upward with an initial velocity , it moves under the constant downward acceleration due to gravity ().
The velocity at any time is given by the kinematic equation:
This equation represents a straight line with a positive y-intercept () and a constant negative slope ().
Initially, the velocity is positive and decreases linearly until it becomes zero at the highest point. As the ball falls back down, the velocity becomes negative and its magnitude increases linearly.
Plot C correctly shows a straight line starting from a positive value on the v-axis, crossing the t-axis, and continuing with a constant negative slope.
Answer: C only
When a ball is thrown vertically upward with an initial velocity , it moves under the constant downward acceleration due to gravity ().
The velocity at any time is given by the kinematic equation:
This equation represents a straight line with a positive y-intercept () and a constant negative slope ().
Initially, the velocity is positive and decreases linearly until it becomes zero at the highest point. As the ball falls back down, the velocity becomes negative and its magnitude increases linearly.
Plot C correctly shows a straight line starting from a positive value on the v-axis, crossing the t-axis, and continuing with a constant negative slope.
Answer: C only