
Concepts Of Physics MCQ Edition [Volume 2]
- Exam
- Concepts Of Physics MCQ Edition [Volume 2]
- Subject
- Physics
- Chapter
- Laws of Thermodynamics
Concepts Of Physics MCQ Edition [Volume 2] · Physics · Laws of Thermodynamics
Two processes on a system are illustrated in the figure. The...
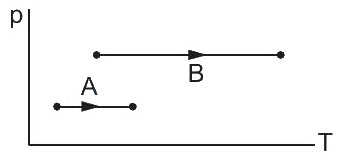
Two processes on a system are illustrated in the figure. The volumes of the initial states are identical for both processes, and the volumes of the final states are also identical. Let and denote the work done by the system in processes and , respectively.
Options
- A
- B
- CThe relation between and cannot be established.
- D
Correct answer
D.
Step-by-step solution
From the given graph, both processes A and B are represented by horizontal lines, which means they are isobaric (constant pressure) processes.
Let the pressure of process A be and that of process B be . From the graph, it is clear that .
The work done by the system in an isobaric process is given by .
It is given that the initial volumes for both processes are identical () and the final volumes are also identical (). Therefore, the change in volume is the same for both processes.
From the graph, the temperature increases in both processes. For an ideal gas at constant pressure, , so the volume must increase, implying .
The work done in process A is .
The work done in process B is .
Since and , we have .
Therefore, , which can be written as .
Let the pressure of process A be and that of process B be . From the graph, it is clear that .
The work done by the system in an isobaric process is given by .
It is given that the initial volumes for both processes are identical () and the final volumes are also identical (). Therefore, the change in volume is the same for both processes.
From the graph, the temperature increases in both processes. For an ideal gas at constant pressure, , so the volume must increase, implying .
The work done in process A is .
The work done in process B is .
Since and , we have .
Therefore, , which can be written as .