Quantrex Quantrex AcademyJEE · NEET · NDA PYQs with solutions Open app
NEET
Exam
NEET
Subject
Physics
Chapter
Mechanical Properties of Solids

NEET · Physics · Mechanical Properties of Solids

The graph below represents a typical stress-strain curve for a...

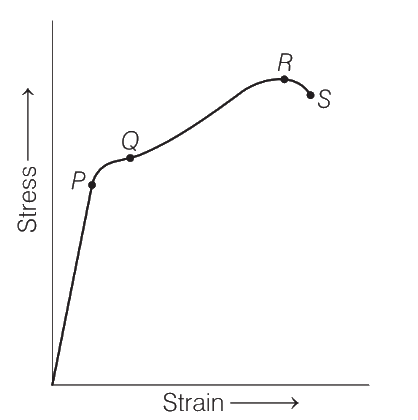
The graph below represents a typical stress-strain curve for a metal. Identify the point on the graph that is the ultimate tensile strength of the material. The graph below represents a typical stress-strain curve for a metal. Identify the point on the graph that is the
Options

  1. AP
  2. BQ
  3. CR
  4. DS

Correct answer

C. R

Step-by-step solution

The point PP indicates the breaking point of the material. The stress originated at this point is called the breaking stress on ultimate stress. ∴R\therefore R is the ultimate tensile strength point of the material. The graph below represents a typical stress-strain curve for a metal. Identify the point on the graph that is the
Practice Mechanical Properties of Solids on Quantrex Academy →

More from Mechanical Properties of Solids

Match List I with List II : List I List II A. Young's Modulus I. (Δ d)/(Δ L)((L)/(d)) B.… NEET 2026A metallic bar of Young's modulus, 0.5 × 10^ 11 ~N ~m^ -2 and coefficient of linear… NEET 2024The maximum elongation of a steel wire of 1 m length if the elastic limit of steel and… NEET 2024Let a wire be suspended from the ceiling (rigid support) and stretched by a weight W… NEET 2023The amount of elastic potential energy per unit volume (in SI unit) of a steel wire of… NEET 2023Given below are two statements : One is labelled as Assertion (A) and the other is… NEET 2022A wire of length L , area of cross section A is hanging from a fixed support. The length… NEET 2020Identify the incorrect statement. AIIMS 2019 Full Mechanical Properties of Solids list All NEET PYQs